Part 1 Battery Storage and Energy Arbitrage
This ITPEnergised insights series examines the techno-economics of solar PV and battery storage colocation projects in the GB (Great Britain) market. The series is arranged with an introduction to battery storage first, then builds from this in the remainder of the series to discuss the key value drivers of additionally including solar PV with battery storage in colocation (figures are illustrative).
- Part 1 – Battery Storage and Energy Arbitrage
- Part 2 – Introducing the Techno-Economics of Solar PV and Battery Storage Colocation Projects
- Part 3 – Impact of Wholesale Price Volatility on Solar PV and Battery Colocation Techno-Economics
- Part 4 – Key Drivers of Solar PV and Battery Colocation Techno-Economics
Part 1 – Battery Storage and Energy Arbitrage
There is increased investment appetite for battery storage in both standalone and in colocation configurations. In colocation battery storage can be included with one or more renewable generators and/or thermal generators alongside other new energy frontier technologies such as green hydrogen, EV (Electric Vehicles) charging and industrial scale heat pumps to name a few.
The mainstream colocation configurations are solar PV and battery storage and wind and battery storage where the addition of the battery enables the potential to capture a more diverse revenue stream as an upside to the base case techno-economics of a solar PV or wind farm alone. It also acts as a downside mitigant and physical hedge against solar PV/ wind/or both cannibalising the wholesale power price when there is a surplus of renewable energy compared to demand; giving an ability to time shift generation and therefore mitigate value erosion for colocation projects with merchant exposure and/or uncontracted revenue streams. Investors are becoming more comfortable with this form of merchant form of revenue stack as increasing intermittency from renewable generators drives an equivalent and exponentially increasing rise in the services that are then needed to balance the power grid. The Balancing Mechanism was valued at c £1b in 2019 but this rose to c £4b in 2022. In the space of 4 years this is a 4X rise.
To build up colocation knowledge on a step-by-step basis we start by solely examining the techno-economics of battery storage in a standalone configuration with a particular focus on wholesale power price arbitrage. The other key revenue streams are derived generically from the Balancing Mechanism, frequency response and the Capacity Market. The key revenue streams are described in Table 1 below:
| Revenue Stream | Description |
| Wholesale power price arbitrage | A dispatch strategy for a battery will be to charge from the grid when prices are low or negative and discharge back to the grid when prices are high and positive, such as during the evening peak demand. This is the only revenue stream that is currently non location specific in the present national market format. |
| Balancing Mechanism | The National Grid ESO (Electricity System Operator) uses the Balancing Mechanism to balance supply and demand on the grid with participants being either paid to increase power supply or paid to lower power supply. |
| Frequency response | The grid needs to be balanced not just in terms of energy supply and demand but also for frequency. The target frequency is set at 50Hz in the UK market. Deviations to this frequency is caused by loss of generation or demand. The service is linked to the largest potential loss of generation or demand. In the GB market frequency response is an Ancillary Services market and is split into three National Grid ESO procured services: Dynamic Regulation, Dynamic Moderation and Dynamic Containment. The first two operate within frequency deviation windows of +/-0.2Hz and the latter within +/-0.2-0.5Hz. |
| Capacity Market | The Capacity Market comprises a fixed payment to suppliers to enable security of supply. These can be contracts tenors of 1, 3 and 15 years. The battery storage asset class attracts a derating factor and longer duration batteries can secure higher derating factors improving economics. This contracted revenue helps to de-risk a battery project but typically only forms a small proportion of overall revenues. Capacity Market revenues can be stacked with other revenue streams. |
The remainder of this paper focuses on wholesale power price arbitrage revenue streams based on historic out turns in the market. Similar analysis can be run for forecast wholesale power market prices by settlement period to gain an understanding of future economic value. Dayahead wholesale power prices for 2020-2023 are shown in Figure 1 below.
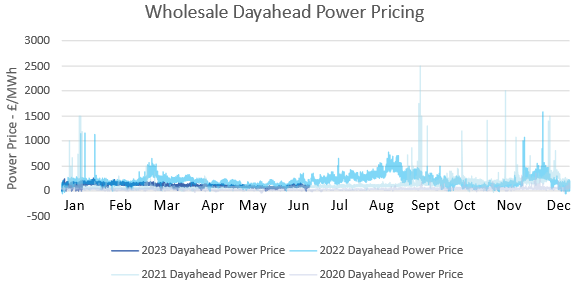
As can be seen from Figure 1 dayahead wholesale power pricing has been increasing in volatility and in range. This pattern is also generally true within day. Coefficients of determination1, or R2, for 2022-2020 are 0.0087, 0.2813 and 0.1602 respectively which is illustrative of the increased volatility with increasing intermittent renewable generation. The highest volatility occurs in 2022 coincident largely with an increase in wind generation of 23% in 2022 of 15TWh compared with 2021. The higher power pricing levels, on average, are likely caused by several factors including but not limited to increased uncertainty in the wholesale power markets with the Ukraine conflict, Nord Stream 1 gas flows from Russia becoming impacted (the power market follows movements in the gas markets) and filling European gas storage along with a drop off in French nuclear capacity. Whilst 2023 has since softened in lower wholesale power prices compared to 2022, it is unlikely we will return to the low pre-Covid levels of wholesale power price volatility or the relative wholesale power price stability we have seen for over a decade.
[1]The coefficient of determination is a number that ranges between 0 and 1 that represents the variation in the response variable against an independent variable in the linear regression model. The lower the R2 the greater the variability.
The corresponding analysis of how these power prices might be used for charging and discharging a standalone battery storage project can be illustrated in Figures 2-4 below for each of the full years data in 2020-2022. The x-axis represents time periods during each study year from the start to the end of each calendar year. The charts use the same power price y-axis maxima and minima to facilitate easier comparison.
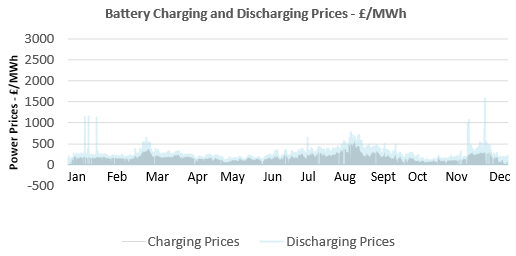
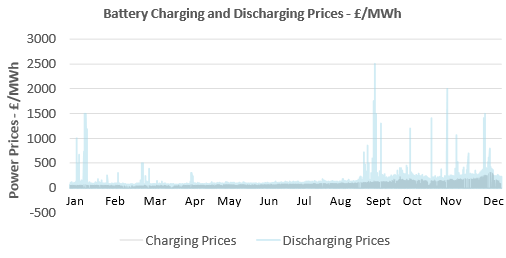
As can be seen from the above charts, battery storage spreads have been increasing over time. A corresponding techno-economic assessment of the present value (PV) in £ of 2-and 4-hour duration battery power arbitrage revenues potential is shown illustratively for years 2020-2022 in Figure 5 below. Please note the actual PV values have been removed to highlight the visual comparison of the relative sizing of each bar chart for the 2- and 4-hour duration battery storage study case.
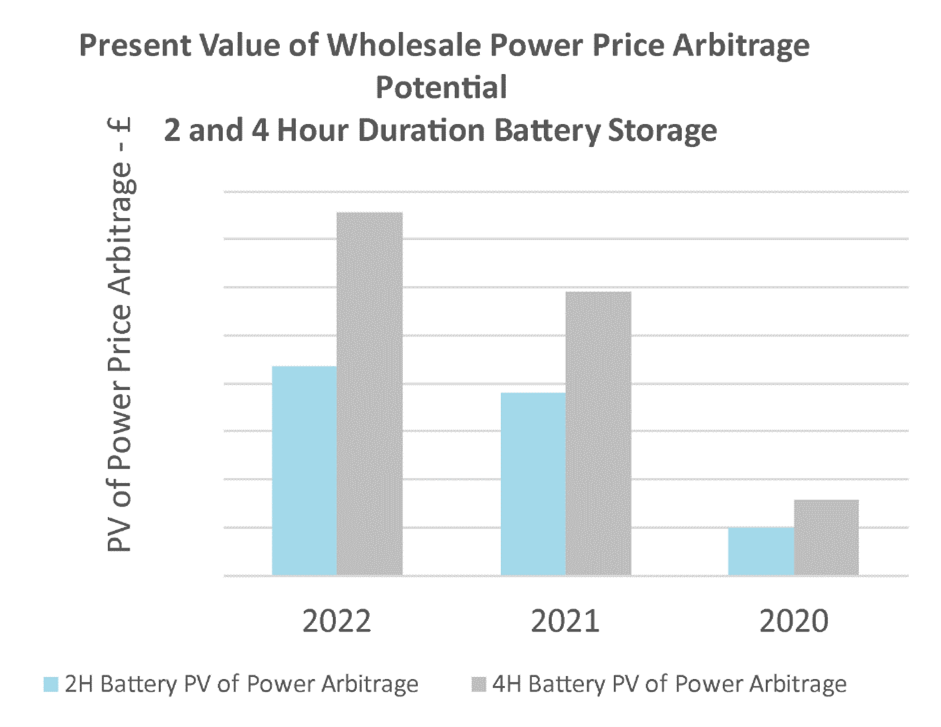
* PV numbers have been deliberately removed to focus on relative value
This chart shows the improving economics of standalone 2-and 4-hour duration battery storage in recent times, associated with the corresponding increase in wind generation in the GB power grid amongst other drivers. Wind power generation has more volatility than solar PV generation on average.
As more intermittent renewable generation is added to reach net zero, we would expect a general trend of increasing wholesale market price volatility and an increase in National Grid ESO procurement of services from battery storage, and other forms of storage, in the Balancing Market, for frequency response and for capacity until such time when a saturation point is reached with higher penetration of storage and / or other balancing technologies and some of these more shallow markets start to cannibalise.
You can view and download a PDF of this article here.
In our next insight paper, we will introduce the concept of colocated solar PV and battery storage and a high-level techno-economic consulting framework for battery sizing optimisation. To find out how we can help you optimise the size your colocation project and to provide accompanying due diligence services please contact Peter Lo, Head of Onshore Renewables and Storage at peter.lo@itpenergised.com.
© Copyright 2023 ITPEnergised. The concepts and information contained in this document are the property of Energised Environments Limited, ITPE Ltd and Xero Energy Limited, trading as ITPEnergised. Use or copying of this document in whole or in part without the written permission of ITPEnergised companies constitutes an infringement of copyright unless otherwise expressly agreed by contract.
These materials are not intended to be and do not constitute a recommendation to any person or entity as to whether to acquire or dispose of or take any other action in respect of any transactions contemplated in this document. The commercial merits or suitability or expected profitability or benefit of such transactions should be independently determined by the Recipient relying on its own assessment of the legal, tax, accounting, regulatory, financial, credit and other related aspects of the transaction, relying on such information and advice from the Recipient’s own professional advisors and such other experts as it deems relevant.
In preparing this document, ITPEnergised has relied on publicly available information and has assumed, without independent verification, the accuracy and completeness of all such information. To the extent permitted by law, ITPEnergised does not accept any liability whatsoever for any loss howsoever arising, directly or indirectly, from use of or reliance on, this document or any other written or oral communications with or information provided to the recipient in connection with its subject matter. ITPEnergised has not conducted any evaluation or appraisal of any assets or liabilities of the company or companies mentioned herein or of any other person referred to in this document. Although all information has been obtained from, and relied on sources believed to be reliable, no undertaking, representation or warranty, express or implied, is made in relation to the accuracy or completeness of the information presented herein or any other written or oral communications with or information provided, or its suitability for any particular purpose.